Skip to content
uptime99 · a free on-call simulator and DevOps game

Practice On-Call Before It Counts.

You're the new hire on a platform team. A page lands in #incidents, checkout is failing and the CTO wants an update. Read the dashboards, find what changed, roll it back, tell people, then get a debrief on every call you made.

Inside Arclab right now
10 on-call shifts4 real tools51 incident typeskubectl terminalNo account needed
A Shift

Quiet. Then Not.

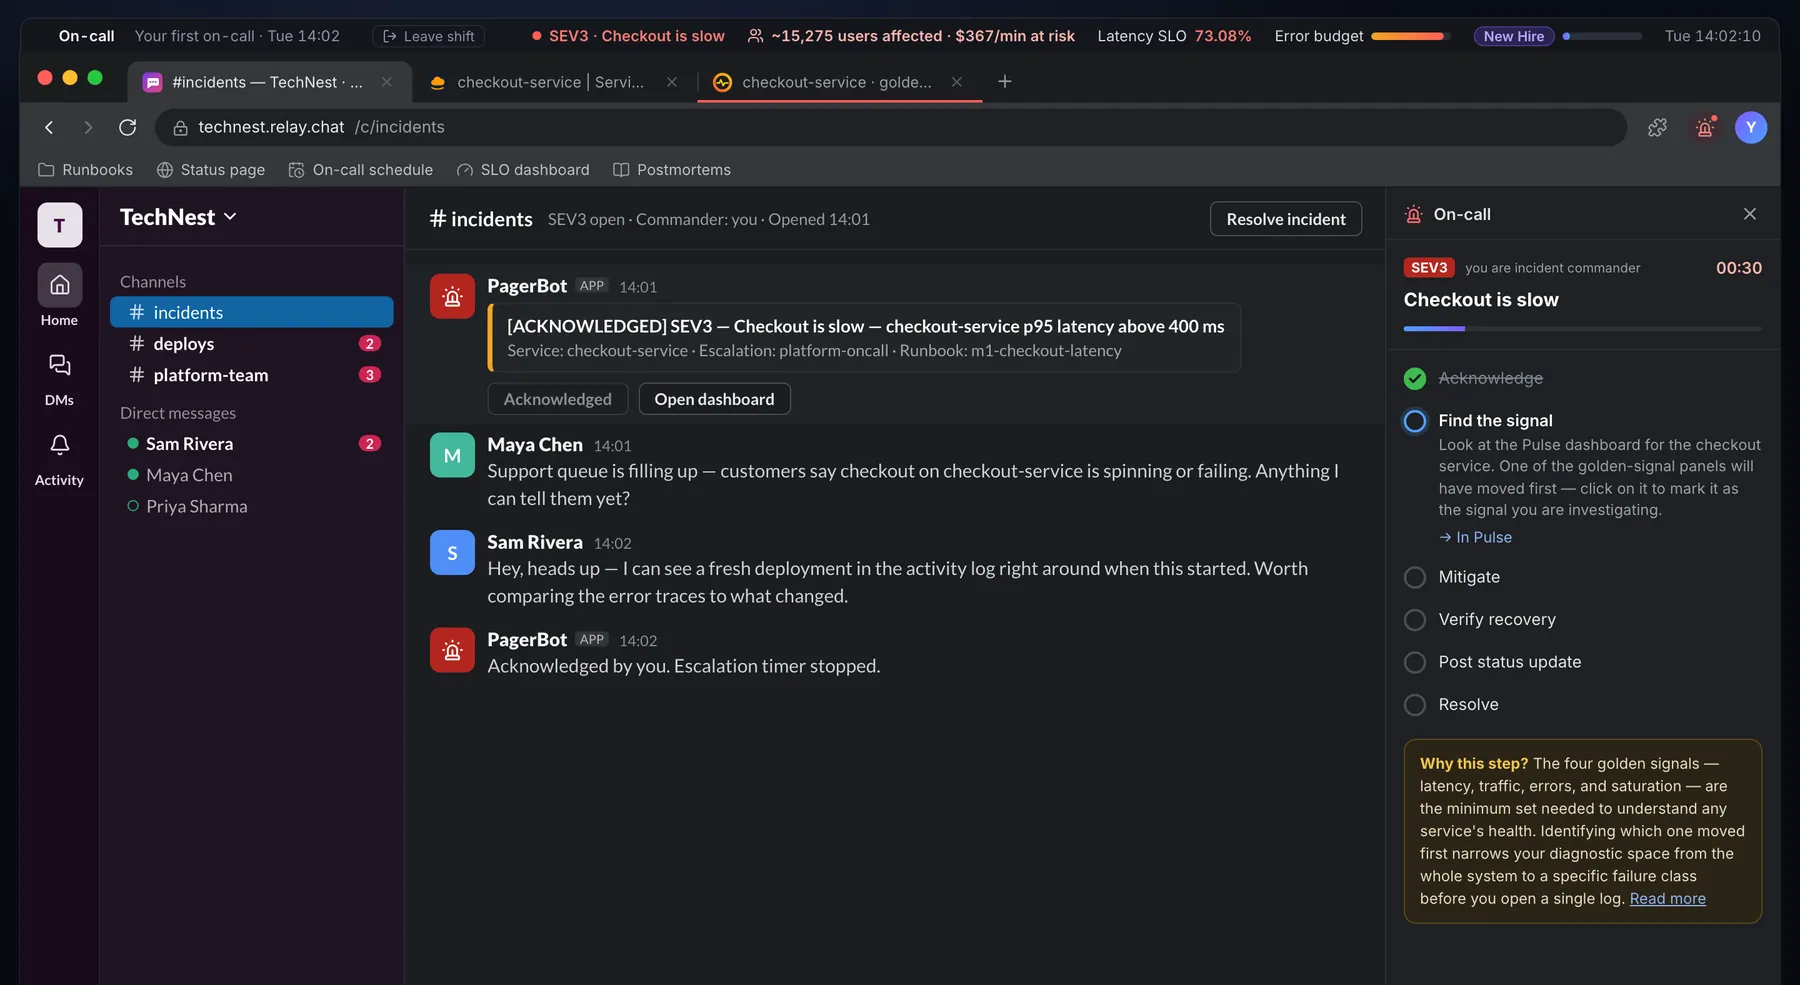
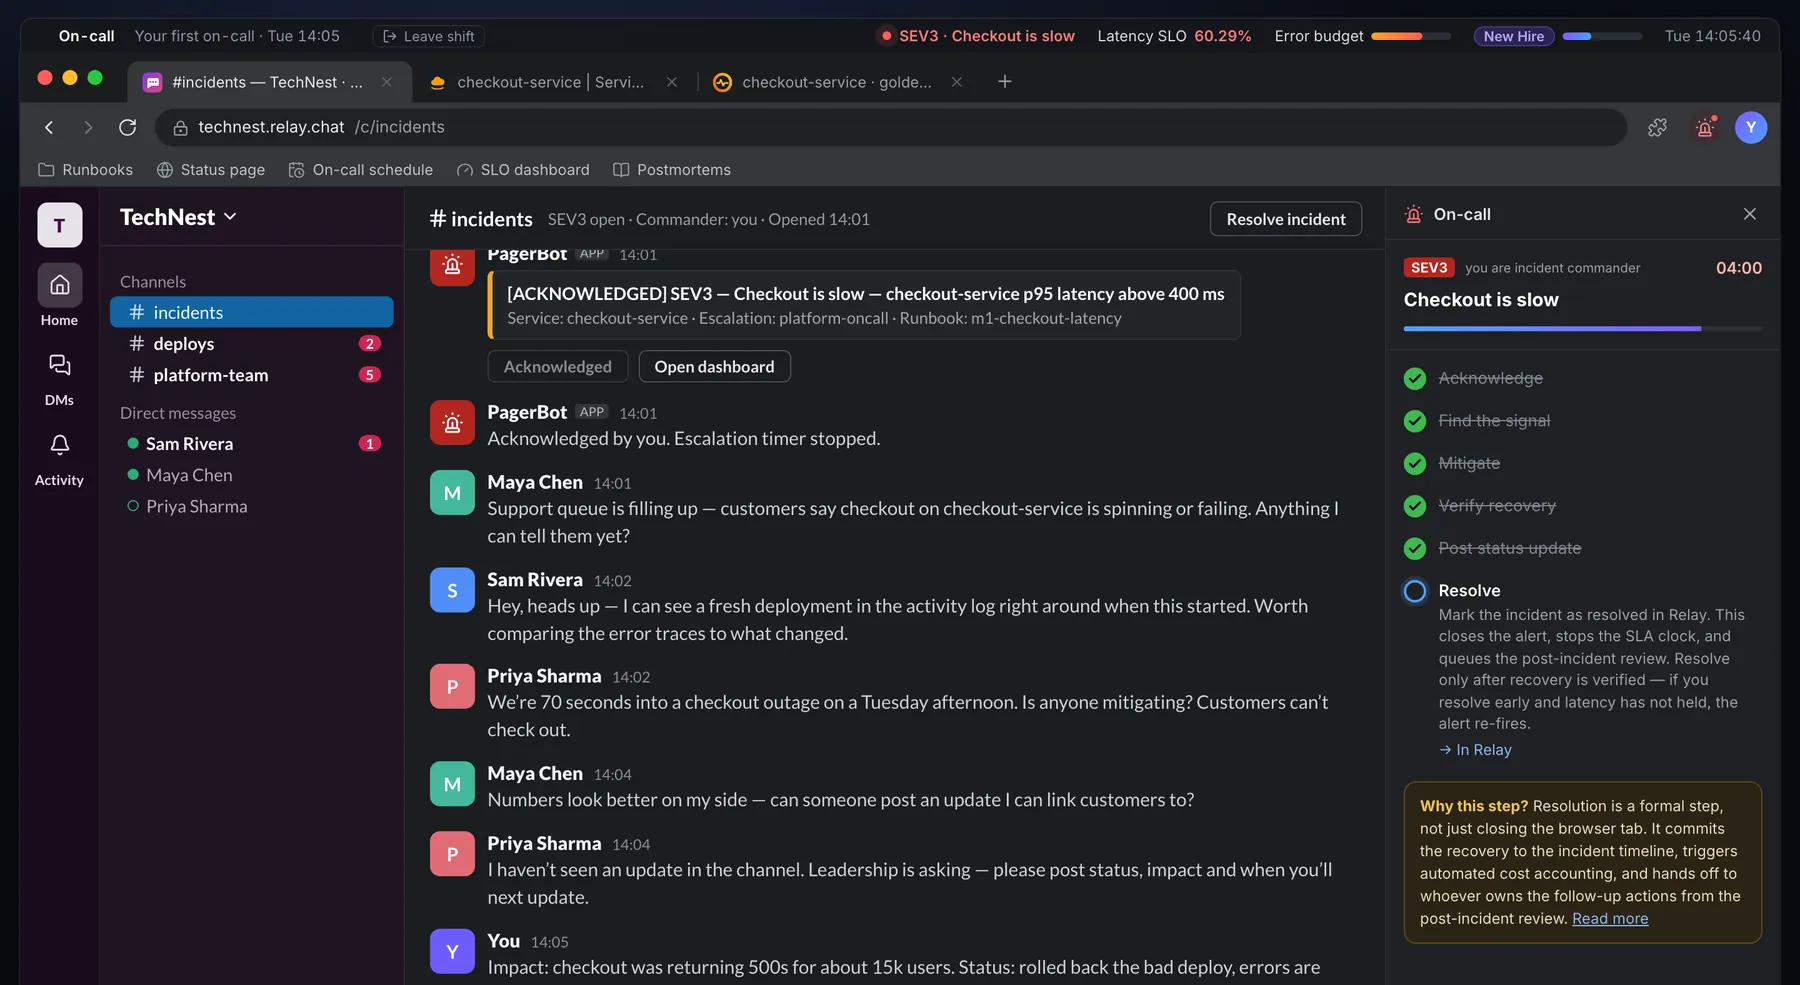
uptime99 Relay chat: a PagerBot SEV3 alert, Checkout is slow, acknowledged, with the support lead and the SRE lead replying in #incidents
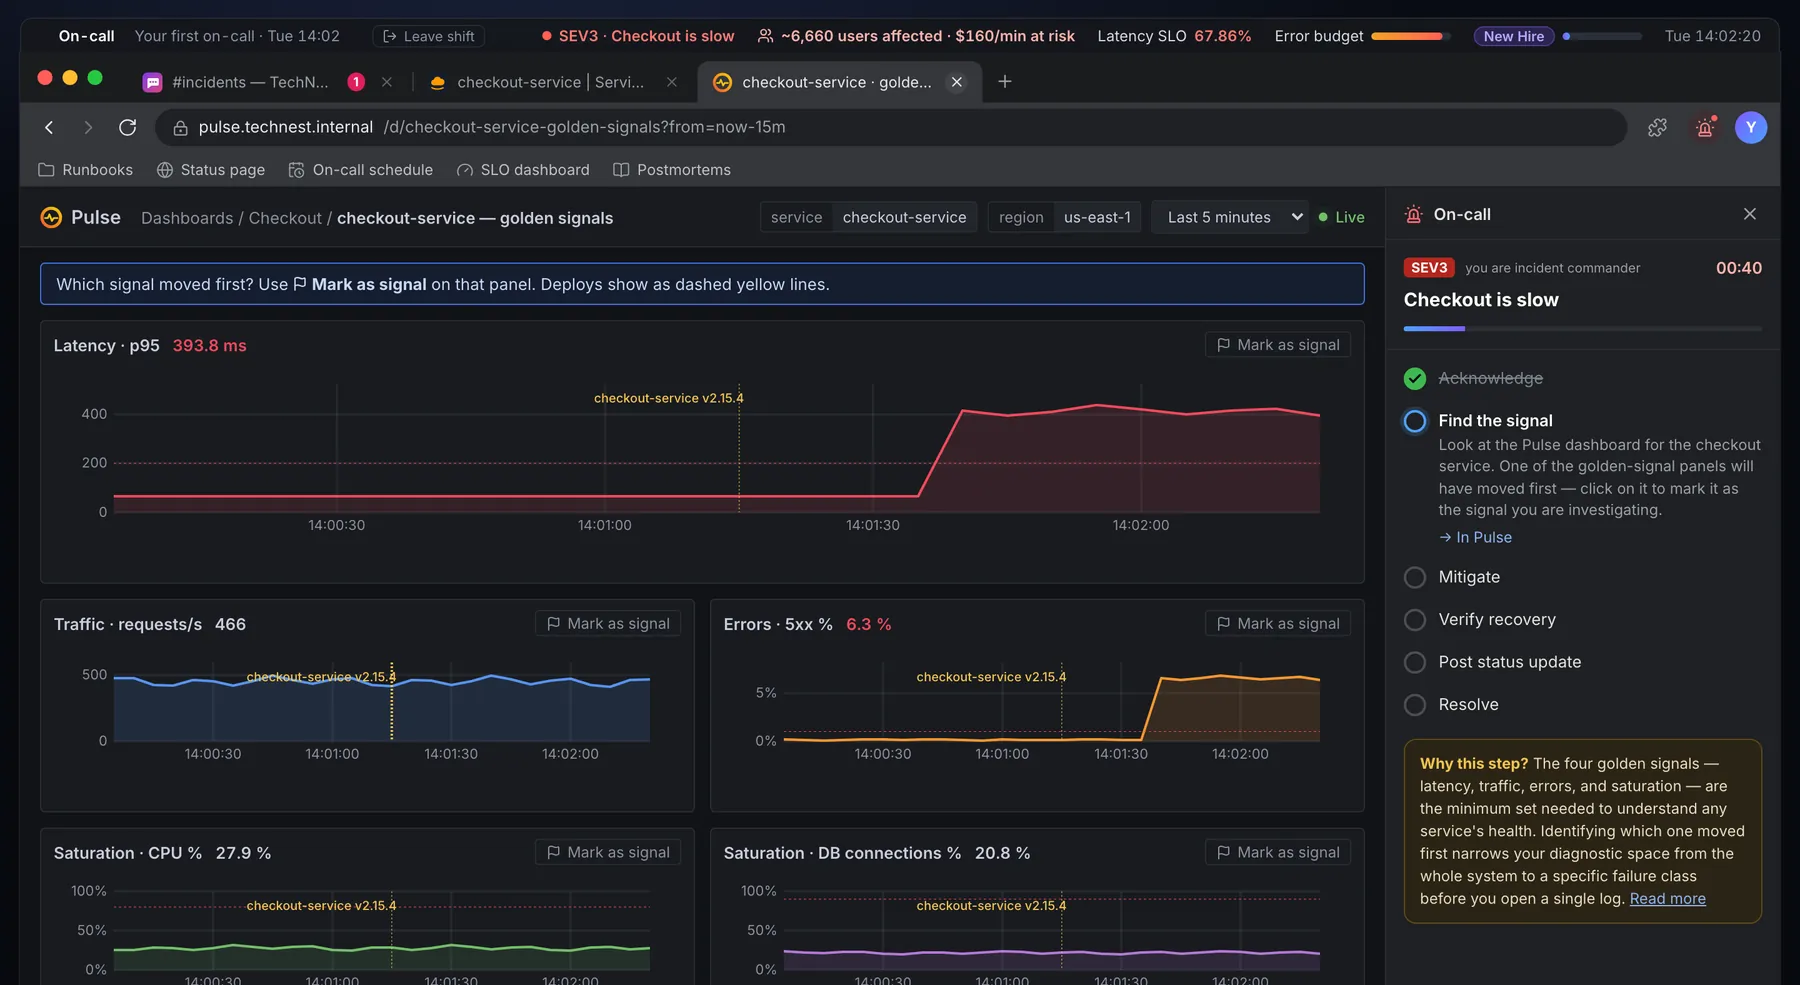
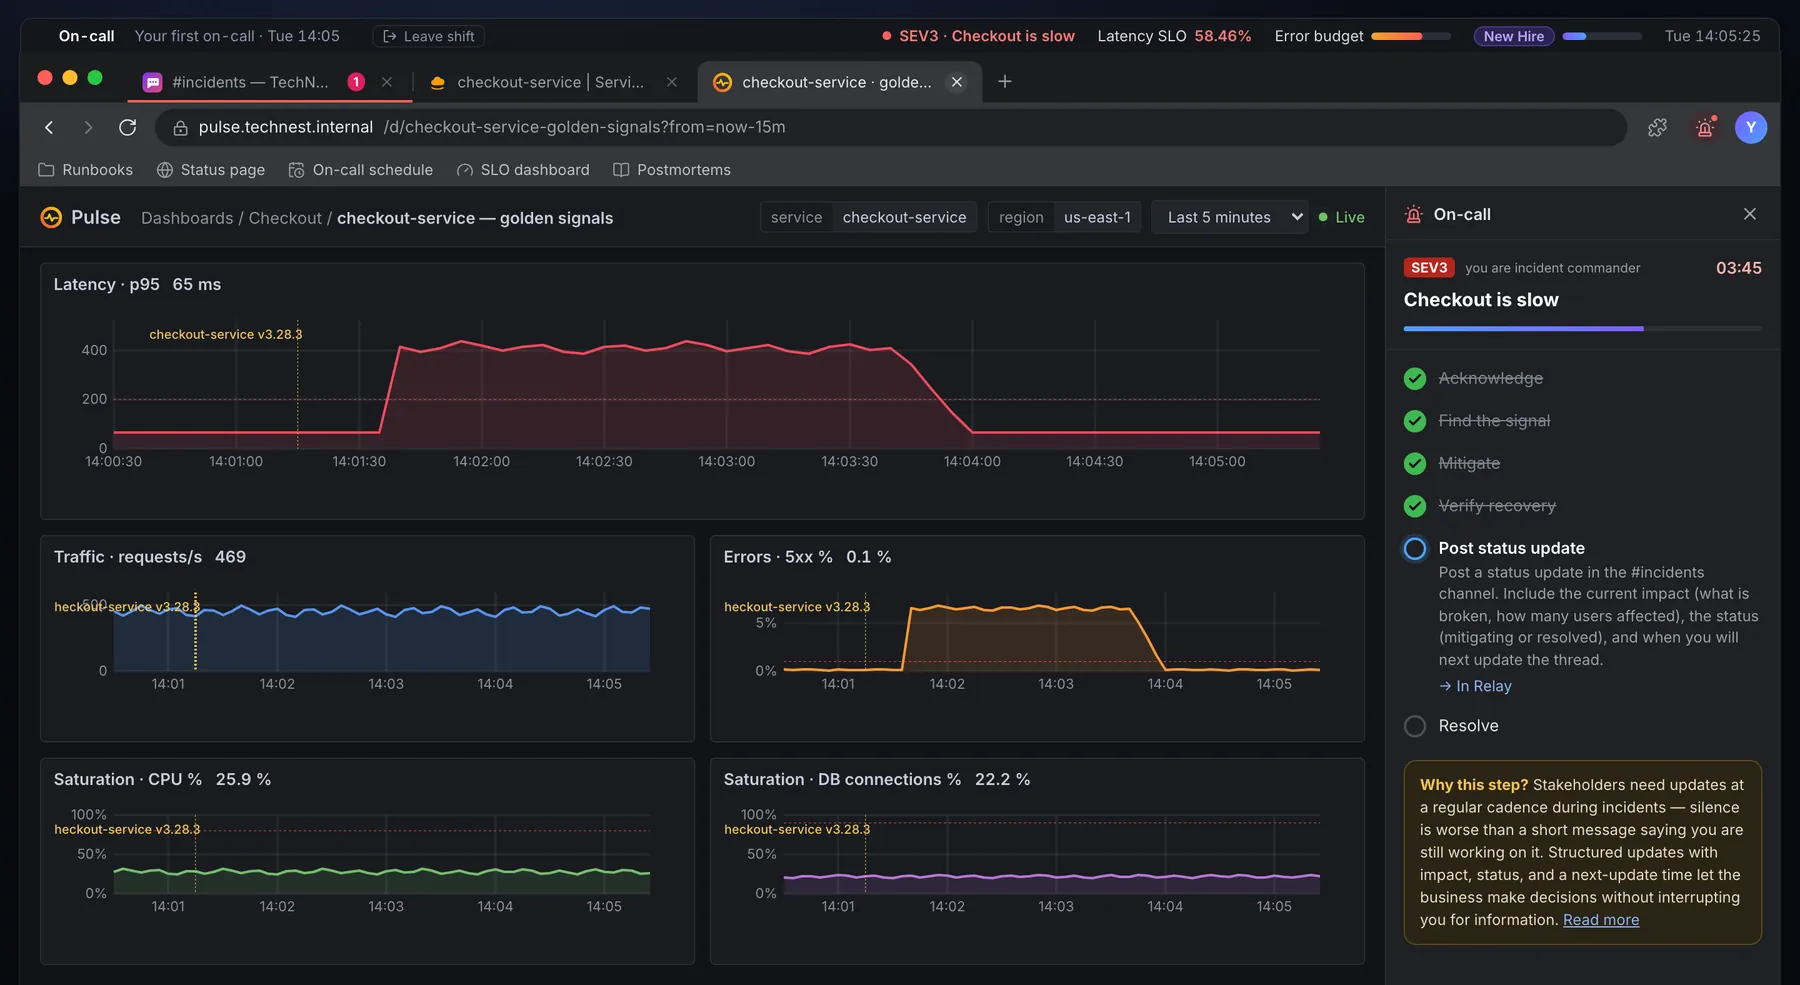
uptime99 Pulse dashboard: checkout-service golden signals, with p95 latency and the 5xx error rate jumping after a deploy line
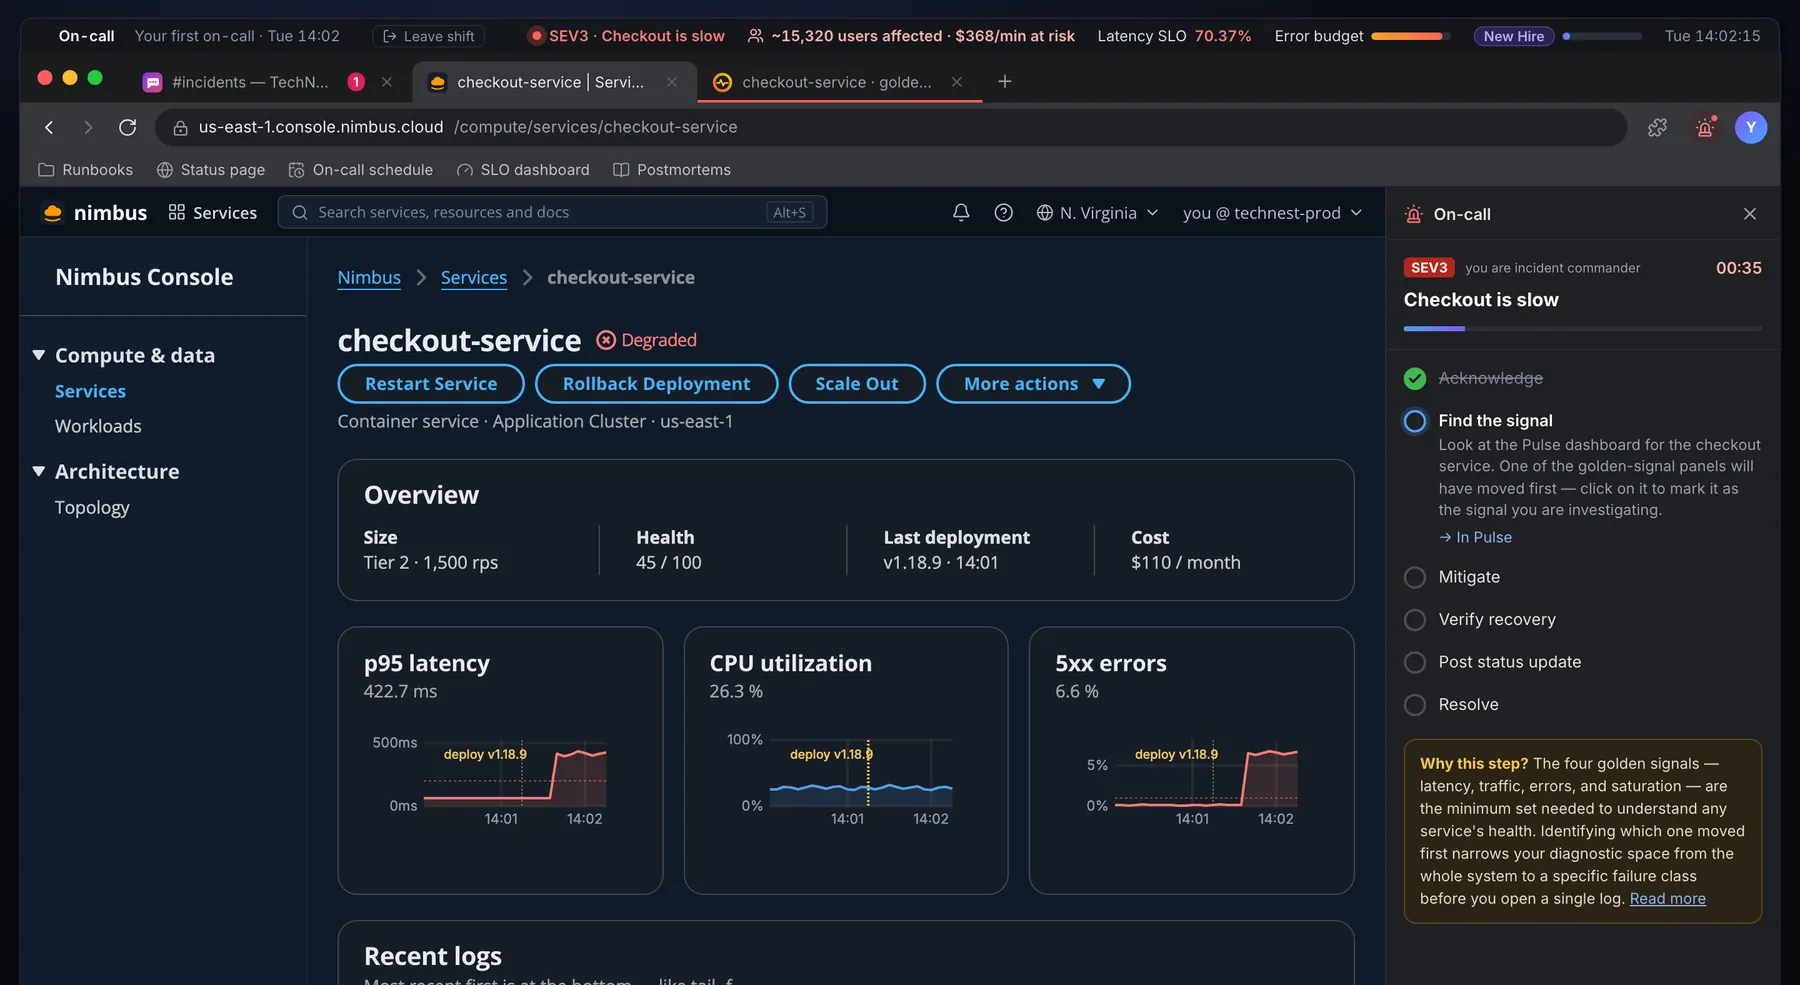
uptime99 Nimbus Console: checkout-service marked Degraded, with Restart, Rollback Deployment and Scale Out actions and crash logs
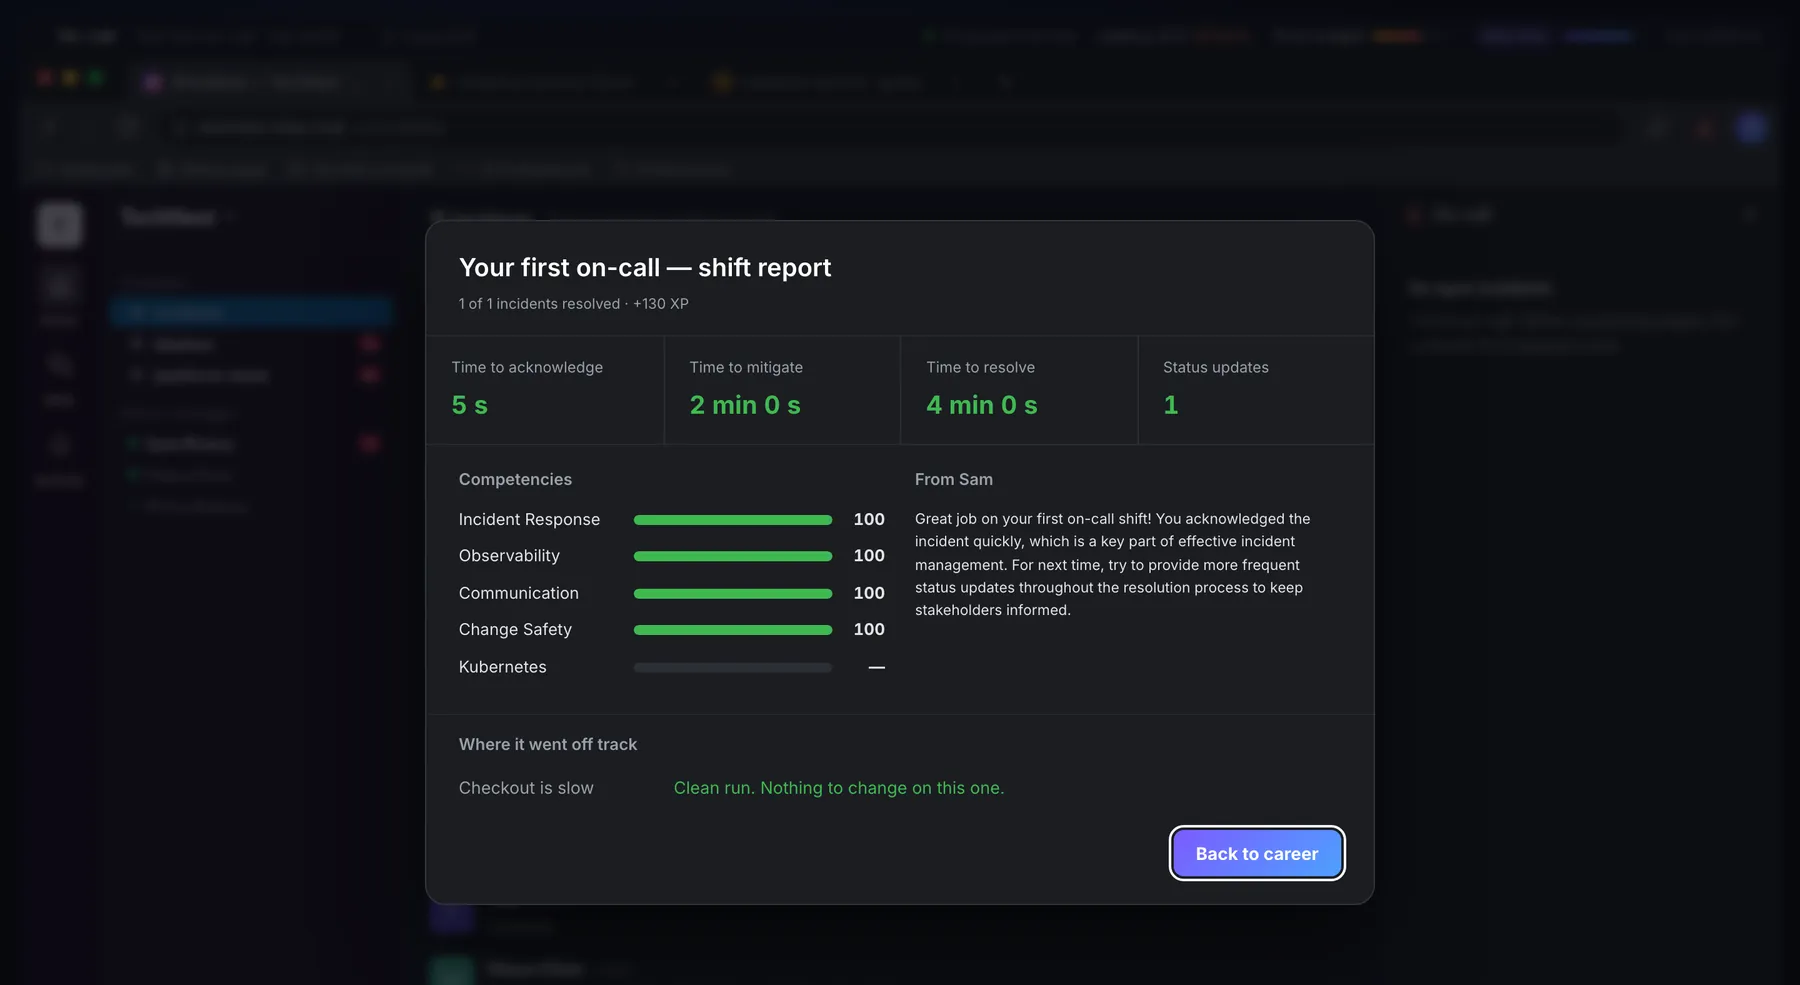
uptime99 shift report: time to acknowledge 5 s, mitigate 2 min, resolve 4 min, competency scores and where it went off track
1.

14:01 · The page

PagerBot posts a SEV3 in #incidents: checkout is slow, about 15,000 users affected, $366 a minute at risk. Acknowledge it before it escalates.

2.

Find the signal

Pulse shows the four golden signals with every deploy drawn on the chart. Mark the one that moved first. Latency is the obvious guess, and it's wrong.

3.

Stop the impact

The Nimbus console shows checkout-service Degraded and a nil pointer panic one minute after the deploy. Roll back, scale out or restart: each costs time.

4.

Debrief

Time to acknowledge, mitigate and resolve, a score per competency, and the first step where you left the ideal path.

See It Up Close

More From Inside uptime99.

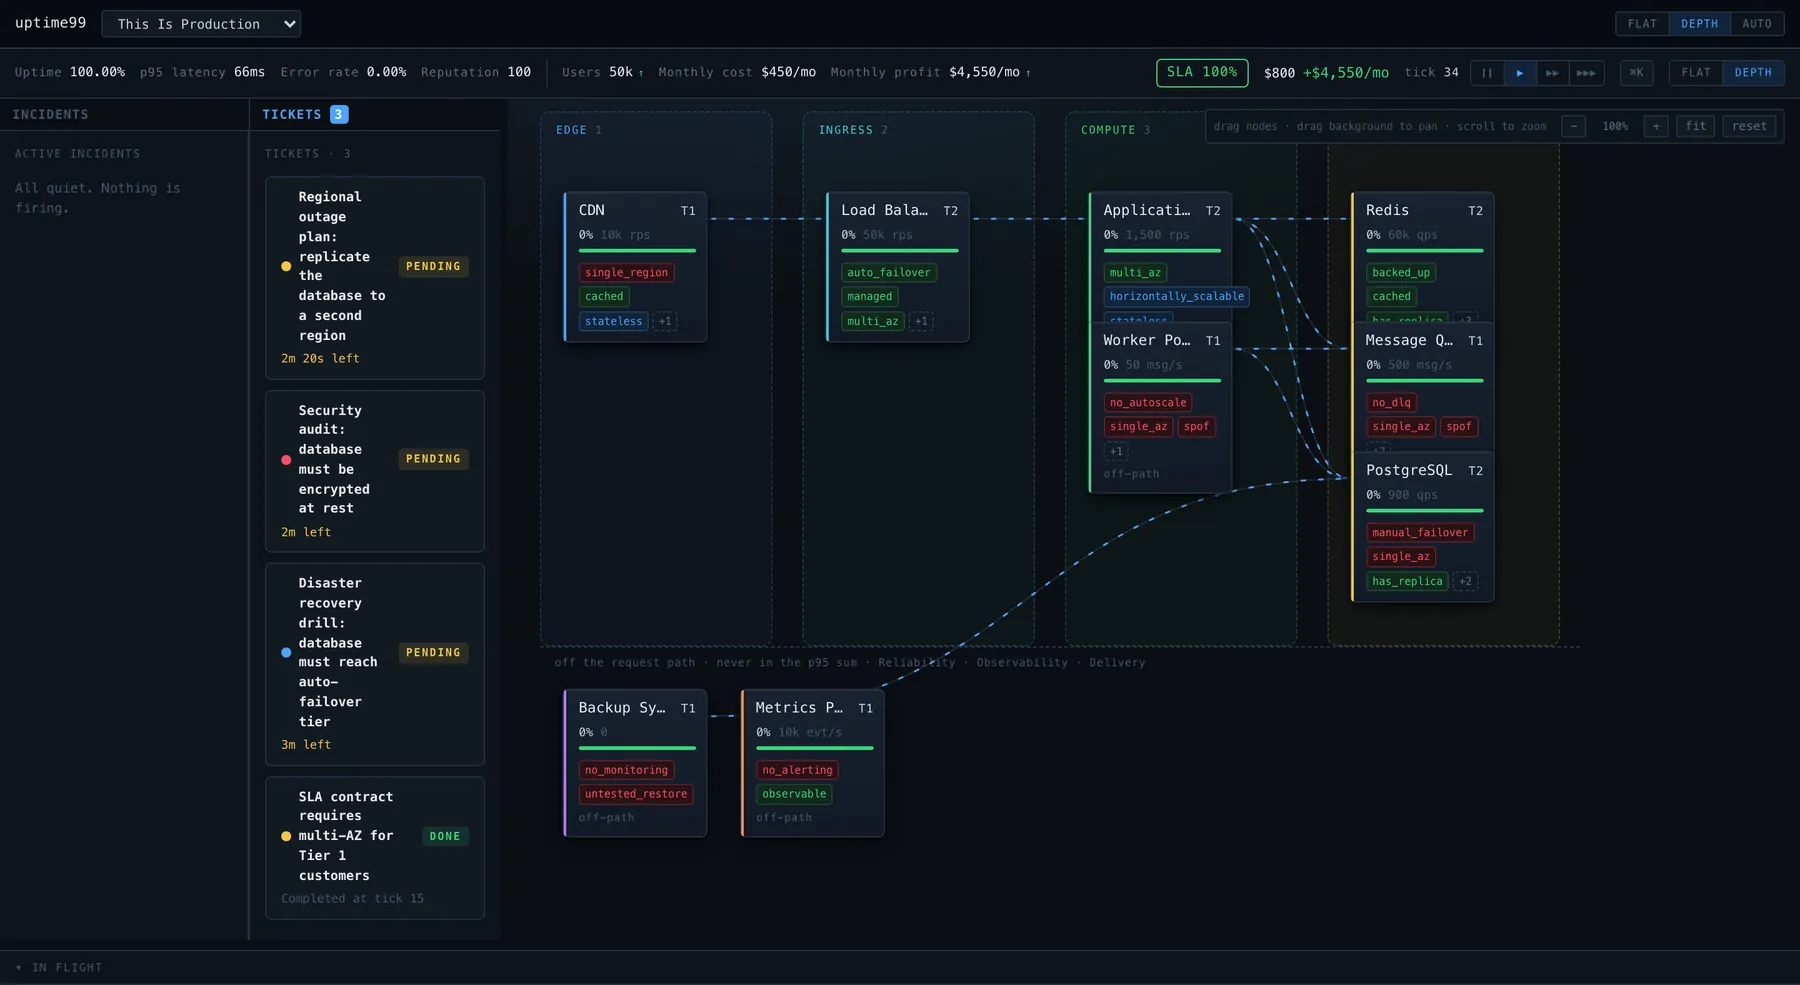
Two ways to play. Workstation puts you on shift as a new hire. Architect hands you a board, a budget and 51 kinds of trouble.

uptime99 Architect mode: a production board from CDN to PostgreSQL with weakness tags, monthly cost and pending tickets
Architect mode. Design the system, then keep it alive through incidents, tickets and stakeholder messages on a monthly budget. Every weakness on the board is a tag an incident can find.
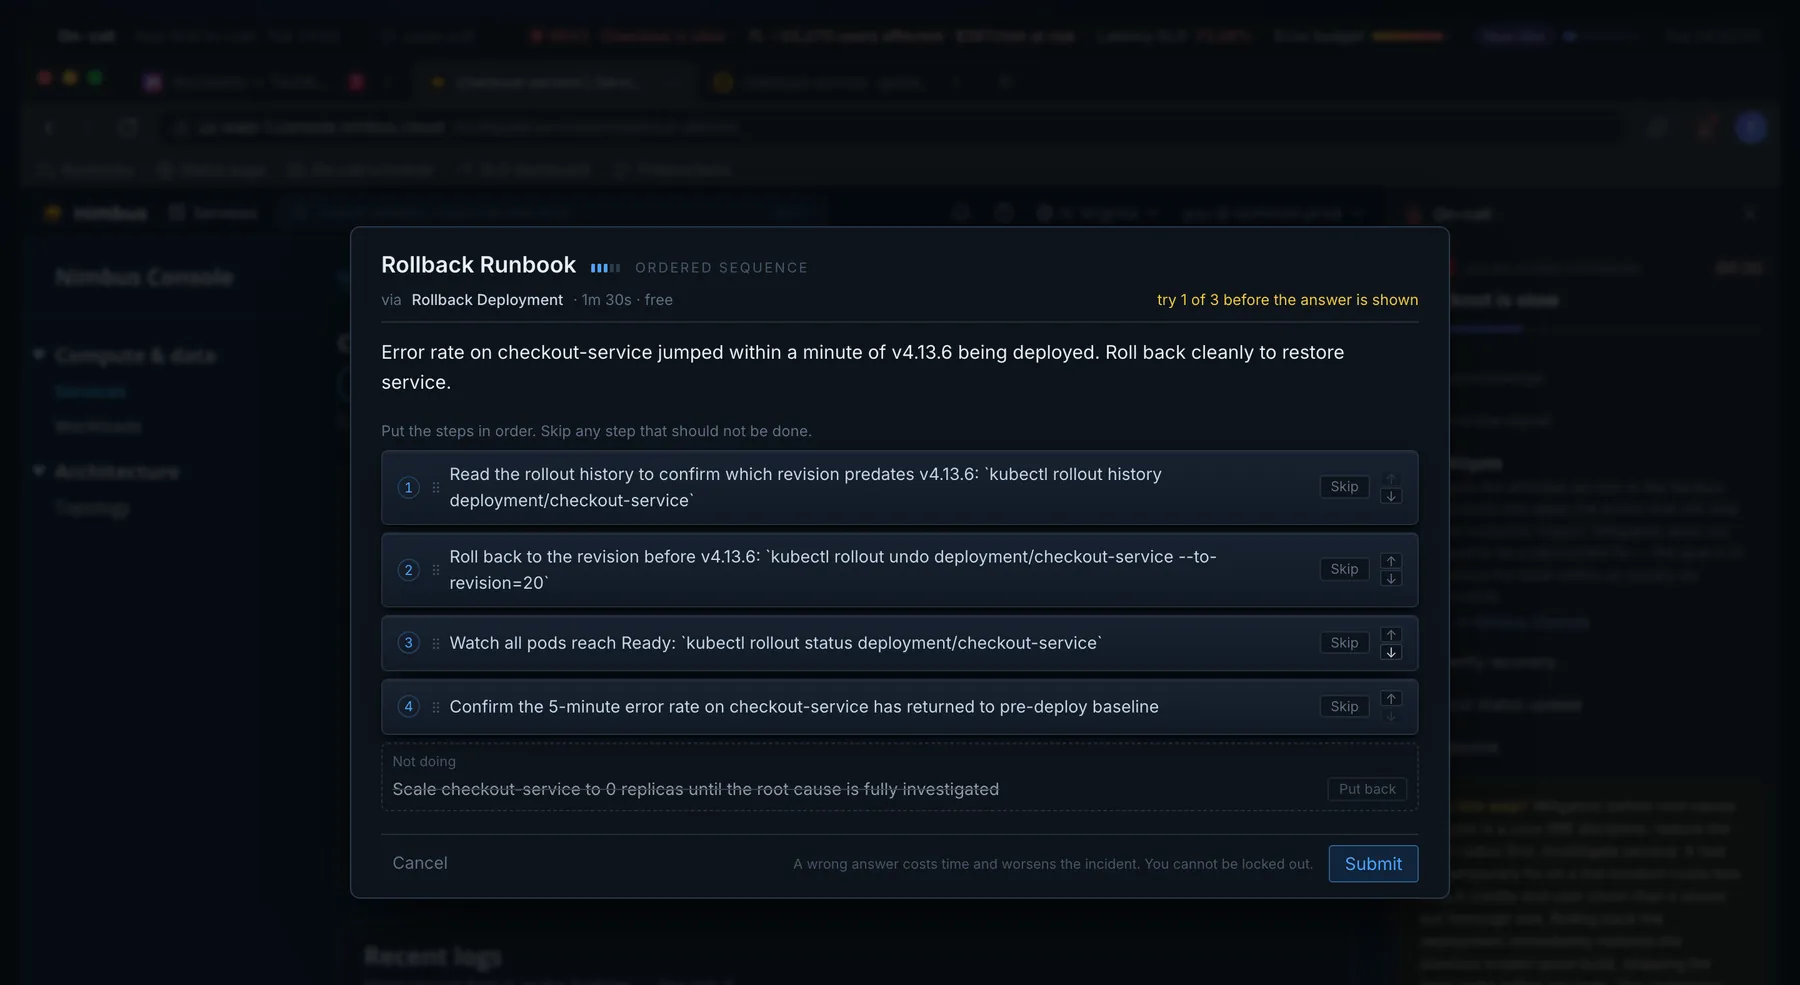
uptime99 Rollback Runbook puzzle: order the kubectl rollout steps and skip the one that would make the outage worse
Runbook puzzles. Every fix is a short puzzle: order a rollback, fill in a config, read a log or type the command. Three tries, then the answer and why.
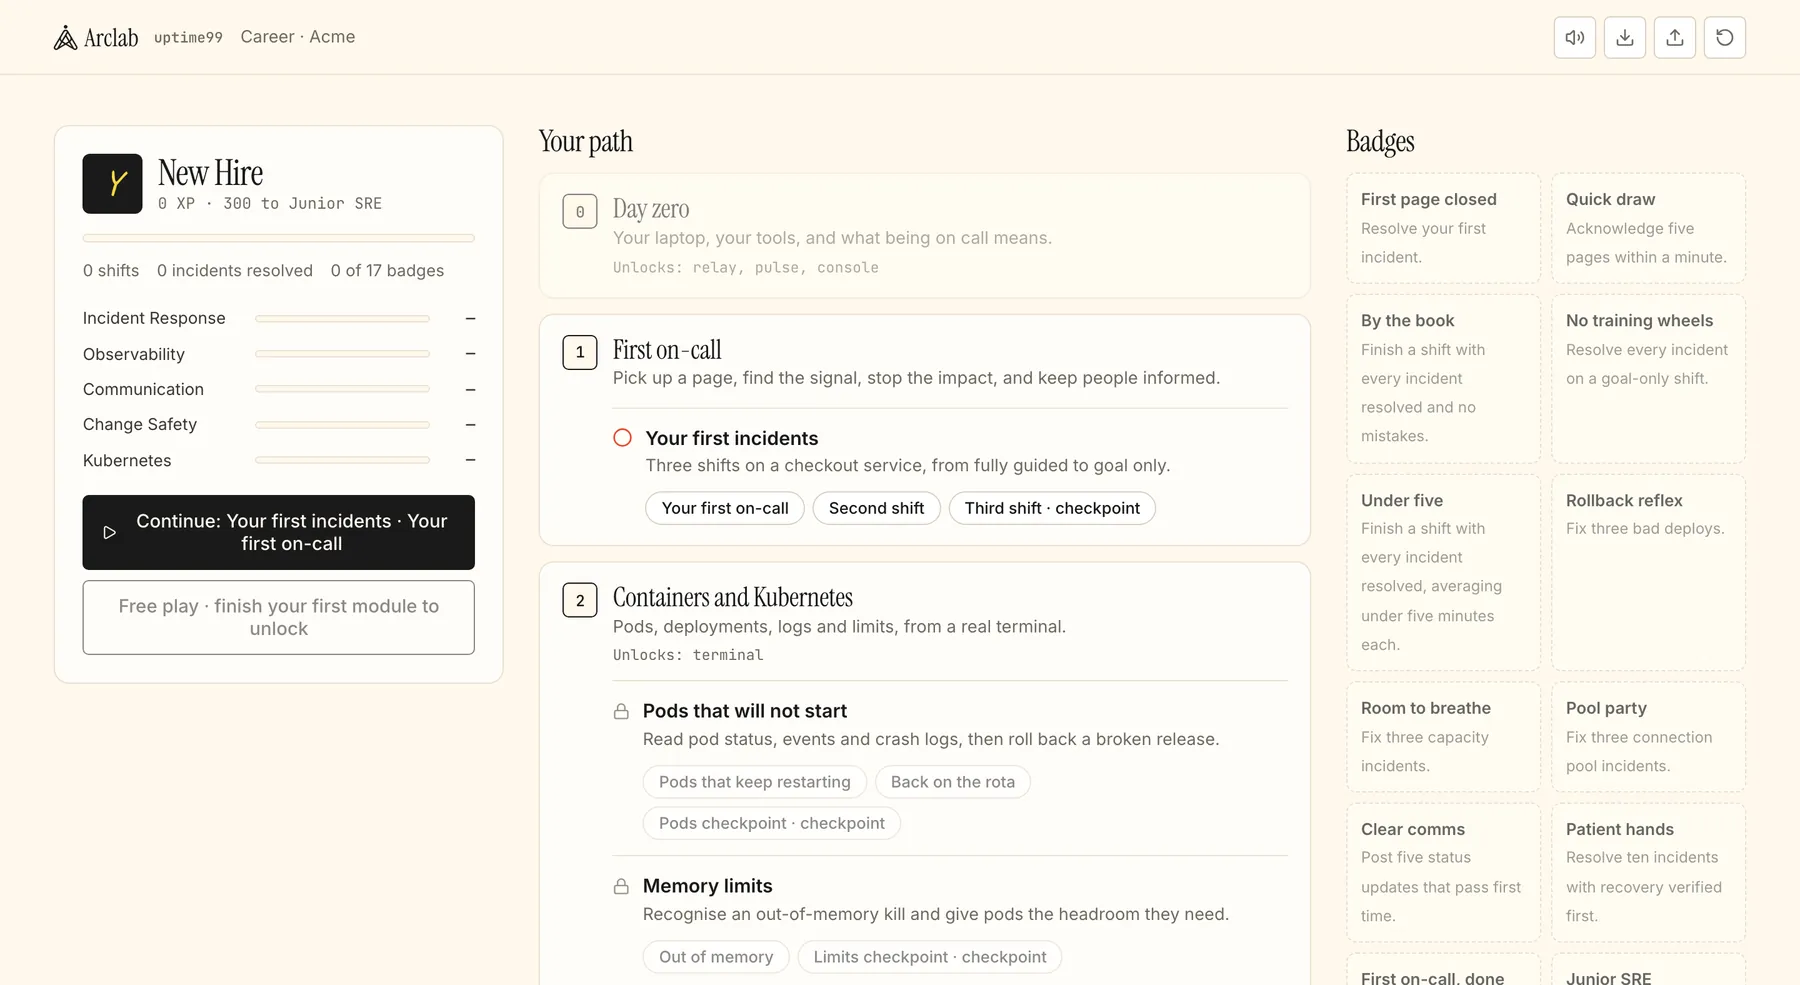
uptime99 career home: New Hire level, competency bars, the First on-call and Kubernetes arcs, and 17 badges to earn
Career home. Your level, five competencies, the course and 17 badges. Saved in your browser; export it any time.

Your Shift Starts At 14:00.

No open incidents. Yet.

Start your first shift →
The Notebook

Real Moments From A Shift.

Play the first shift ›
#incidents · relay
PagerBot  14:01
SEV3 · Checkout is slow
p95 latency above 400 ms
~15,250 users · $366/min at risk
 [Acknowledge]
acked in 5 s

PAGE. [ACKNOWLEDGED] SEV3, Checkout is slow: checkout-service p95 latency above 400 ms. Runbook m1-checkout-latency.

relay · first on-call · 14:01
pulse · golden signals
Latency p95   393.8 ms
Traffic       466 rps
Errors 5xx    6.3 %
--- deploy v2.15.4 ---
Not the first signal to move.
errors moved first

"Not the first signal to move." You marked latency. Errors jumped first, right on the dashed deploy line.

pulse · find the signal
checkout-service · logs
14:01:10 deploy sha=a4f2c9e1 complete
14:01:17 ERROR panic: nil pointer
  at promo_engine.go:112
14:01:24 WARN crash loop (exit 2)
14:01:31 ERROR HTTP 500 /checkout
roll it back?

promo_engine.go:112. checkout_handler panic: nil pointer dereference, one minute after deploy sha=a4f2c9e1. Your call.

nimbus console · recent logs
nimbus shell · acme-prod
 kubectl get pods
checkout-api-…-s89f5  CrashLoopBackOff
 kubectl logs … --previous
FATAL PAYMENTS_API_URL is not set
 kubectl rollout undo deploy/checkout-api
never started

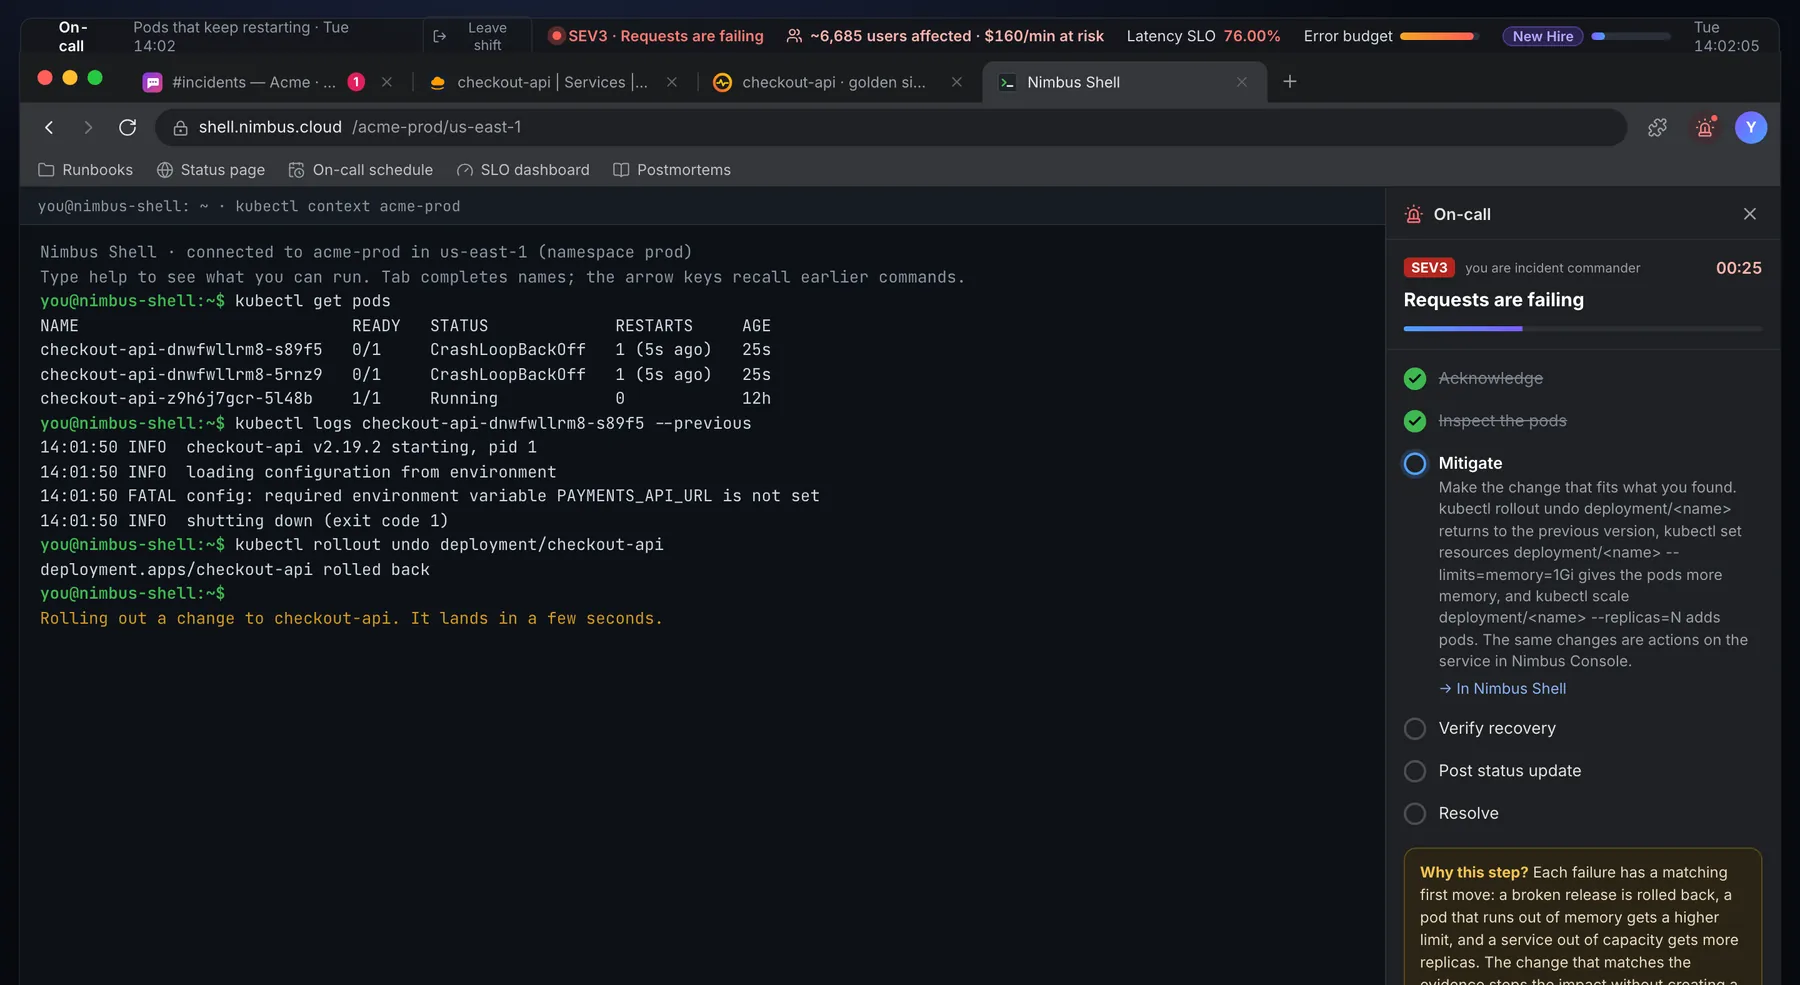
kubectl logs --previous. FATAL config: required environment variable PAYMENTS_API_URL is not set. The new pods never started.

nimbus shell · pods that keep restarting
#incidents · relay
Priya Sharma (CTO)  14:02
Is anyone mitigating?
Priya Sharma (CTO)  14:04
please post status, impact and
when you'll next update.
post the update

Priya Sharma, CTO. "We're 70 seconds into a checkout outage on a Tuesday afternoon. Is anyone mitigating?"

relay · #incidents · 14:02
Northwind · enterprise
Are we getting SLA credits?
 Offer SLA credit   −$200
  Credits after review
  Deny the breach
reply in 24 s or it expires
every answer costs

Northwind, enterprise customer. "Our contract has an SLA. Are we getting credits for this?" Offer the credit, defer it, or deny the breach.

architect · stakeholder message
Try It

Take A Page, Right Here.

uptime99 / technest-prod / control-panel-apiTue 14:00 · first on-call
Latency SLO
100.00%
Error budget
100%
One Real Shift

Ten Minutes On Call, Minute By Minute.

This is the first course shift, played on October 1, 2026. Nothing below is a mockup: it is what the game showed and what it scored.

  1. All systems normal

    Sam, your lead, says hi. Four services in technest-prod, a latency SLO at 100% and a full error budget. The first shift runs at half speed so you can read.

  2. The page

    SEV3, Checkout is slow. About 15,000 users affected and $366 a minute at risk. Maya from support asks what she can tell customers.

  3. Acknowledged in 5 seconds

    The escalation timer stops and you are incident commander.

  4. Errors moved first

    In Pulse, latency looks worse, but the 5xx rate jumped first, right on the deploy line. That is the signal.

  5. Roll back

    The console shows a nil pointer panic in the new release. The Rollback Runbook puzzle asks for the kubectl steps in order, and one step you should skip: scaling to zero.

  6. Verify, don't hope

    p95 latency has to hold below 200 ms for 30 seconds. Resolve on the first dip and the alert fires again.

  7. Tell people

    Priya, the CTO, asks for an update. Yours needs the impact, the status and when you'll next update. Then /resolve. Duration: 4 minutes.

  8. The debrief

    Acknowledge 5 s, mitigate 2 min, resolve 4 min, one status update, +130 XP. Where it went off track: clean run.

Later shifts draw the root cause at random, so the same moves won't always work. That's the point.

The Tools

Your Laptop For The Shift.

A shift happens in a browser full of the tools a platform team uses. They're simulated, but they behave like the real ones, down to kubectl's error messages.

uptime99 Relay: the player's status update with impact, status and next update time, after the CTO asks for one

Relay

Team chat. Pages arrive in #incidents, teammates message you as the incident unfolds, and you post the updates people are waiting for.

  • PagerBot alerts with severity, service and runbook
  • Sam (your lead), Maya (support) and Priya (CTO) react to what you do
  • Status updates are checked for impact, status and next update time
uptime99 Pulse dashboard: p95 latency and errors back to baseline after the rollback, with the runbook steps checked off

Pulse

The dashboard. Latency, traffic, errors and saturation for the service that paged, with every deploy marked on the chart.

  • Mark the signal that moved first
  • Watch recovery hold before you resolve
  • SLO and error budget burn in the menu bar
uptime99 Nimbus Console: checkout-service marked Degraded, with Restart, Rollback Deployment and Scale Out actions and crash logs

Nimbus Console

The cloud console. Services with health, size and monthly cost, recent logs, and the actions that change production.

  • Restart, Rollback Deployment, Scale Out and more
  • Workloads view with deployments and pods
  • A service map from the edge to the database
uptime99 Nimbus Shell: kubectl get pods shows CrashLoopBackOff, logs --previous shows a missing environment variable, then rollout undo

Nimbus Shell

A kubectl terminal on the same cluster the console shows. Unlocks with the Kubernetes arc.

  • get pods, describe pod, logs --previous
  • rollout undo, set resources, scale --replicas
  • Tab completion and real kubectl errors
What Breaks

51 Ways Production Goes Down.

Architect mode draws from 51 incident types in seven families. Each one targets a weakness on your board, like a single zone, no tested restore or no autoscaling, so what you built decides what hurts.

10

Infrastructure

  • Availability zone outage
  • Out-of-memory kill
  • Primary node failure
  • Clock skew
9

Data

  • Replication lag spike
  • Connection pool exhausted
  • Cache eviction storm
  • Backup corruption
8

Capacity

  • Traffic spike
  • DDoS attack
  • Vertical limit reached
  • Alert storm
8

Security

  • Credential stuffing
  • Certificate expiry
  • Ransomware attack
  • TLS handshake error
6

Queue

  • Consumer crash
  • Poison message
  • Dead-letter queue overflow
5

Delivery

  • Bad deploy
  • Canary anomaly
  • Regression after deploy
5

Business

  • SLA breach
  • PCI audit failure
  • GDPR breach notification

Workstation shifts use seven root causes so far: bad deploy, saturated capacity, an exhausted connection pool, a crash loop from missing config, an image pull failure, an out-of-memory kill and scaling under load.

The Course

From New Hire To Staff SRE.

Workstation is a course made of shifts. Each module starts fully guided, then names the steps, then gives you only the goal, and its last shift is a checkpoint with a random root cause. Finish the first module and free play opens: a day of pages planned from what you have learned.

1

First on-call

Pick up a page, find the signal, stop the impact and keep people informed.

Your first incidents

A checkout service, a bad deploy, saturated capacity or an exhausted connection pool.

Your first on-call · guidedSecond shift · named stepsThird shift · checkpoint
2

Containers and Kubernetes

Pods, deployments, logs and limits, from a kubectl terminal.

Pods that will not start

Read pod status, events and crash logs, then roll back a broken release.

Pods that keep restarting · guidedBack on the rota · named stepsPods checkpoint
Memory limits

Recognize an out-of-memory kill and give pods the headroom they need.

Out of memory · guidedLimits checkpoint
Scaling under load

Spot pods that are healthy but saturated, and add replicas.

Healthy but slow · guidedArc 2 checkpoint
  1. New Hire
  2. Junior SRE
  3. Junior SRE II
  4. SRE I
  5. SRE II
  6. Senior SRE I
  7. Senior SRE II
  8. Staff SRE
Incident ResponseObservabilityCommunicationChange SafetyKubernetes
How It Compares

Practice You Can't Get From A Book.

Featureuptime99Reading about SREVideo courseYour first real rotation
A live page to respond to--
Chat, dashboards, console and kubectl-demo only
Teammates asking for updates--
Mistakes cost nothing-
A debrief on every call you made--sometimes
Freeoftenvariesyou're paid

uptime99 is a simulation: the cloud, the company and the teammates are invented. The failure modes, the signals and the commands are real.

Who It's For

For Anyone Who Will Carry A Pager.

  • first on-call next week
  • junior SRE
  • platform engineer
  • backend dev joining the rota
  • bootcamp grad
  • career switcher
  • prepping an SRE interview
  • learning Kubernetes
  • never read a dashboard
  • curious about DevOps
  • team lead running drills
  • tired of tutorials

What You Practice

Incident response

Acknowledge, find the signal, mitigate, verify, update, resolve. In that order.

Reading dashboards

Latency, traffic, errors and saturation, and which one moved first.

Kubernetes troubleshooting

Pods, events, previous logs, rollouts, memory limits and replicas, with kubectl.

Change safety

Why a bad deploy can look like a bad database, and when to roll back.

Incident communication

Updates with impact, status and a next-update time, before anyone has to ask.

System design and cost

Architect mode: capacity, redundancy and backups on a monthly budget.

Questions.

What is an on-call simulator?

A game that recreates an on-call shift: an alert pages you, you investigate with dashboards, logs and a terminal, you fix it and you tell people. uptime99 runs in your browser and ends every shift with a debrief.

Can you learn DevOps by playing a game?

Yes, if the game is built on real failure modes. uptime99 shifts come from common production incidents, the commands are real kubectl, and every fix explains why it works.

Is uptime99 free?

Yes. Workstation and Architect are free to play in your browser, with no account needed.

Do I need DevOps or Kubernetes experience?

No. The first shift is fully guided and runs at half speed, and your lead explains each step. The Kubernetes arc starts from what a pod is.

Does it teach Kubernetes and kubectl?

The troubleshooting side: get pods, describe, logs --previous, events, rollout undo, set resources and scale, across crash loops, image pull failures, out-of-memory kills and scaling under load.

What is the difference between Workstation and Architect?

Workstation is a career course: you work on-call shifts as a new hire with real tools. Architect is a strategy game: you design the system, then keep it up through incidents, tickets and a budget.

How long is a shift?

A few minutes of game time. The guided first shift takes about ten minutes, and checkpoints are shorter.

Can I use it to practice for an SRE interview?

Yes. The checkpoint shifts give you only the goal and a random root cause, which is close to a live incident interview. The debrief shows where your reasoning left the ideal path.

Is this the same as a tabletop exercise?

No. A tabletop is a discussion. This is a live simulation where your actions change what happens next.

Where is my progress saved?

In your browser. You can export it, import it on another browser, or reset it from the career home.

No Open Incidents. Yet.